
In November Wildlife Acoustics held a research seminar on advances in soundscape ecology. Talks included views from Dr Micheal Towsey, Dr Bryan Pijanowski, and Dr Amandine Gasc. Below are some of the ideas that were discussed.
Ecoacoustics for ecosystem management - Michael Towsey, Queensland University of Technology
A spectrogram is an image of the sound displaying frequency (Hz/kHz) over time and is a tool that is used by experienced researchers, who can navigate to parts that are of interest. Recordings displayed in this format can be a useful means of studying acoustic vocalisations of species within a defined space and time. Sounds can include bird calls, insects, animals, and can also include human activities.
A recording is a permanent record of sounds, and can be rechecked or reanalysed - it also allows a researcher to be sure of what was observed in the field whilst avoiding their own bias about what was heard.
Advances in technology have enabled researchers to study ecoacoustics or soundscape ecology. Ecoacoustics is all about monitoring ecosystem processes over time and space, whilst bioacoustics allows the study of individual species. If you can imagine setting up a device to record over a year the amount of sounds recorded would be impossible to listen to in real-time - the spectrogram would be rather big! This is because the amount of data runs into the terabytes or petabytes - to put this into perspective 1 terabyte is 1000 gigabytes and 1 petabyte is 1000 terabytes.
So, the best way to deal with all that data is to compress it down into a manageable form. Information in the recordings can be reduced by using acoustic indices - A statistical representation of the distribution of acoustic energy. A four-hour recording can be split into 240 one-minute segments. The acoustic indices that were recommended by Michael were
- ACI (Acoustic Complexity Index),
- H(t), the temporal concentration of acoustic energy
- CVR (cover), where the signal-to-noise ratio is above a threshold in terms of acoustic energy.
You can use ACI, H(t), and CVR to show different information.
Along with this you can achieve more data reduction and give you more imaging possibilities by clustering acoustic classes, such as rain, birds, insects, wind, rain, vehicles, etc.

You can visualise different sounds throughout a 24 hour period using a year's worth of data.

This type of compression and analysis allows you to monitor a range of soundscapes from the forest to the ocean, and get a feeling for the different anthropogenic and 'natural' sound-producing activities. It is also possible to write 'recognisers' that help pick up a species of particular interest, such as invasive species (that need to be monitored) or cryptic species (that call at low frequencies).
Related information:
Phillips, Yvonne & Towsey, Michael & Roe, Paul. (2018). Revealing the ecological content of long-duration audio-recordings of the environment through clustering and visualisation. PLOS ONE. 13. e0193345. 10.1371/journal.pone.0193345.
Towsey, Truskinger, and Roe (2016) Long-duration Audio-recordings of the Environment.
Watkins and Montgomery (2020) Acoustic index-based models for determining time of day in long-duration environmental audio recordings, Ecological Indicators, 117
Acoustic Indices - Dr. Bryan Pijanowski, Center for Global Soundscapes
Bryan is interested in the concept of space and time, and the use of sounds and sensory inputs to navigate around the environment. There is a great variety of variation in individual species, such as age, gender. Animals are navigating through a soundscape and take specific information from that to survive. Animals perceive sound information in different ways - for example, some birds have sound filters. An intensive study requires the use of indices and a good solid understanding of the frequency band of a spectrogram. In relation to this Bryan is interested in:
- whether frequency correlates with current ecological concepts such as low frequencies are often associated with larger body sizes.
- Whether there are any gaps in the ecosystem that are unusual.
- If the health and quality of the ecosystem can be monitored. And how disturbance, climate changes, and landscape changes affect the soundscape.
- Discover the ecological richness of an area and the changes over time, based on sound, in different ecosystems.
- The next generation of indices that will be used.
His soundscape case studies can be found here.
In a ten minute sound file there there are 100s of sounds
... Imagine exploring sounds from over the course of a year or several years!
We're living in a concrete jungle surrounded by not a lot of nature,...selected for limited environments... Its getting out there and truly listening and feeling this emotional feeling, psychological feeling, that wraps around you, it's a solitude. It's just you and nature and there's no one around. And that's when it truly sinks in, that you're a part of this place, this marvellous place called earth... I listen for things that I think should be there, you can listen and hear the gaps, the gaps in that chorus.
Bryan Pijanowski - believes in bringing the experience of nature back to people and highlights the importance of the soundscape in terms of monitoring the environment.
Soundscape analysis: perspectives for biological conservation - Dr Amandine Gasc, Institute of Research for Development
Amandine is interested in how concepts from soundscapes can be applied in a very concrete way to help with conservation. Most of Amandines fieldwork is in New Caledonia. She is interested in
- Improving acoustic indices.
- Working in different habitats and how these can be compared.
- Applying all these tools, e.g. to detect disturbance or monitor restoration.
- Evaluating biodiversity
Amandine likes to compare acoustic sampling to genomic sampling. In genomics, a sample is collected and extracted, before amplification and identification using a gene bank. The results yield a genetic perspective of community composition. Acoustic sampling is very similar in that a soundscape sample is collected, acoustic elements are extracted, and specific parts are isolated and identified using a referential sound library. This gives ecologists an idea of community composition.
In New Caledonia Amandine studies species that are endemic (only occur on that island) and micro-endemism where a species may only be found on one mountain for example. She wanted to know if the soundscape could reflect the unique characteristics of a community. She (with a team) went to three different mountains and set up a Song Meter SM1 and a Song Meter SM2. They showed a temporal correlation, and uniqueness in the sounds recorded on each of the mountains (an acoustic signature). In another study, they monitored an invasive species of ant in forest, pre-forest, and shrubland. They found crickets dominate the night-time soundscape. A drop in sound occurred in invaded sites. Amandine is interested in using soundscape ecology as an early detection system of disturbance, especially in remote areas.
Related Products
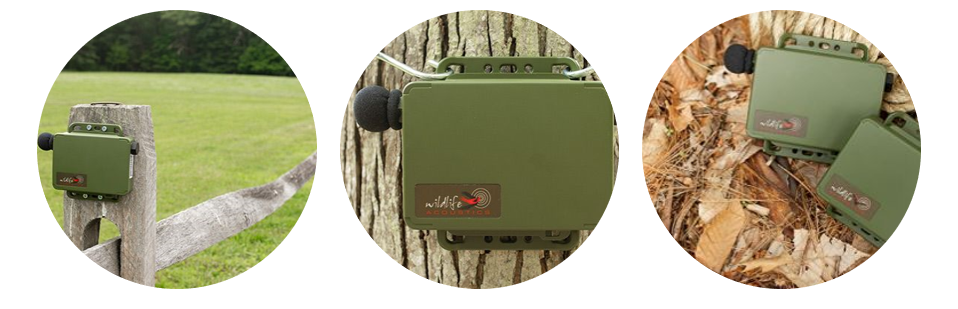
This year Wildlife Acoustic released the Song Meter Mini Acoustic Recorder. It has comparable recording quality to the Song Meter SM4 and brings professional acoustic recording within reach of consultancies, research projects, and citizen science projects.
The unit is easy-to-use, compact and robust, with a capacity to record up to 1200 hours * of acoustic vocalisations. It has a built-in acoustic mono microphone that delivers comparable performance to the SM4 and can also be fitted with an optional second microphone to achieve stereo recording. The Song Meter Mini can be configured via Bluetooth using a free app on your mobile device - this enables you to change settings, schedule recordings, and receive recorder status information wirelessly. You can download the Song Meter Mini Configurator application from The App Store or Google Play , although it is worth noting the operating system requirements.
* Recording durations last for 240 hours on a set of internal alkaline AAs, or 1200 hours when using the optional internal Lithium Ion battery battery pack accessory
The Song Meter Mini is much like the SM4 in that it has a flange that enables you to mount your device to the surface of your choice, whilst using a cable lock to secure it into place. The lid of this device snaps off (it is not hinged) - it has a gasket that creates a seal. Inside the is room for four AA batteries or a lithium-ion battery, and a slot for your SD card.
If you need to know how to start using your Song Meter Mini along with the app you can take a look at the quick start guide.
Can you handle the data?
In short, yes you can! Kaleidoscope is a neat piece of software that is a versatile sound analysis tool for acoustic and ultrasonic data. With this software, you can analyse large amounts of data (terabytes). It has the capacity to undertake batch processing and file conversion and has a unique feature that allows files to be compared and clustered into similar groups. Each cluster can then be examined, listened to, and identified to species, saving hours of work. Important clusters can be named and saved. All kinds of bioacoustics data can be analysed this way, and clusters can be transformed into species-specific Classifiers that will automatically identify species in all future recordings.
The free Viewer element allows you to examine sound files visually, listen to files, manually tag files with identification information, and apply bandpass filters - passing frequencies within a certain range, and attenuating or rejecting frequencies outside a range. If you upgrade to the Pro version you will be able to quickly sort, label, and identify bird songs, frog calls, and bat echolocations from weeks, months, or even years of recordings. The Pro version is designed to minimise the time you spend on your data so that you can start the process of figuring out what your data demonstrates sooner.
If you would like to register your interest for a training session on Kaleidoscope please email [email protected] and state if you would like to learn about acoustic analysis or ultrasonic analysis.
